4 Policy
Week4: 31&2/Jan&Feb/2024
The lecture this week shows a range of policy relevant to remote sensing techniques, from urban heat island to air pollution to disaster response. The following summary will detail London’s policy response to Urban Heat Island effect and how can EO data be incorporated into the strategic planning and solve the current challenges. London Green Belt will be the focus in this entry but admittedly it can be a less effective/direct solution to tackle increasing temperature in the city.
4.1 Summary & Application
4.1.1 Policy Challenge in London
The 2021 London Plan incorporates Urban Heat Island (UHI) effect into the strategic spatial planning. Below are some themes/policies related to UHI.
| Solutions to mitigate & adapt UHI set by the Plan | Linkage to remote sensing data |
|---|---|
| Ensure efficiency and resilience in building and infrastructure design (GG6 B) | Not RS’s specialty |
| (more towards adaptation) Set minimum building height to ensure daylight and ventilation (passive cooling) (3.6.3) | (maybe) using SAR phasing to monitor the building heights, and Sentinel to measure the distance between building blocks, to find areas that would be most affected by insufficient indoor daylight and ventilation and act upon. |
| Green infrastructure provision in an integrated way (8.1) | Suggesting/optimizing tree placement in the hottest areas of new developments & public space (MacLachlan et al. 2021) |
| Green Belt protection (comply with NPPF) –constrain urban sprawl and drive re-use of previously developed brownfield land (8.2.1) | Monitoring Green Belt & open greenspace [detailed below] |
| Urban greening (street trees, green roofs, green walls, and rain gardens) (8.5.2) | Suggesting/optimizing tree placement in the hottest areas of new developments & public space (MacLachlan et al. 2021) Suggesting green roof locations in areas with darker roofs and higher temperature. |
| Manage heat risk through applying cooling hierarchy in new developments (through design, layout, orientation, materials and the incorporation of green infrastructure) (SI 4A; SI 4B; 9.4.1) | Not RS’s specialty, largely depends on design/project management/planning enforcement. Nevertheless, energy-efficient architecture layout can be generated through deep learning (Wan et al. 2022)and Agent Based Modelling (Rahbar et al. 2022)! |
- London Green Belt
-
London’s Green Belt provides an important long-term benefit for all those living in, around and visiting London; its landscape beauty and the haven it provides for an improved and thriving wildlife; its significant contribution to the mitigation of the climate emergency and enhancing people’s health and wellbeing; the facilities it offers for outdoor recreation, and its resource for food and farming close to London; all this in addition to its traditional role of containing urban sprawl and encouraging regeneration. (Source: CPRE, 2019)
4.1.2 Green Belt and open space
Rough workflow:
- Analyse spatial and temporal patterns of urban growth and loss of greenspace.
- Investigate the quality of GB and open greenspace. (since it is found that densification of existing urban areas and development of inner-city brownfield sites are the main source of land use change, instead of expansion to GB which is controlled by GB policies in 2000 (Langsdale 2017))
To see the boundary of GB (land cover / land use changes):
Landsat/Sentinel –> classification (veg vs land) (e.g. a supervised classifier (Random Forest) mentioned in Week7). (Langsdale 2017)
May mask the boundary of GB to further analysis changes in % of vegetation.
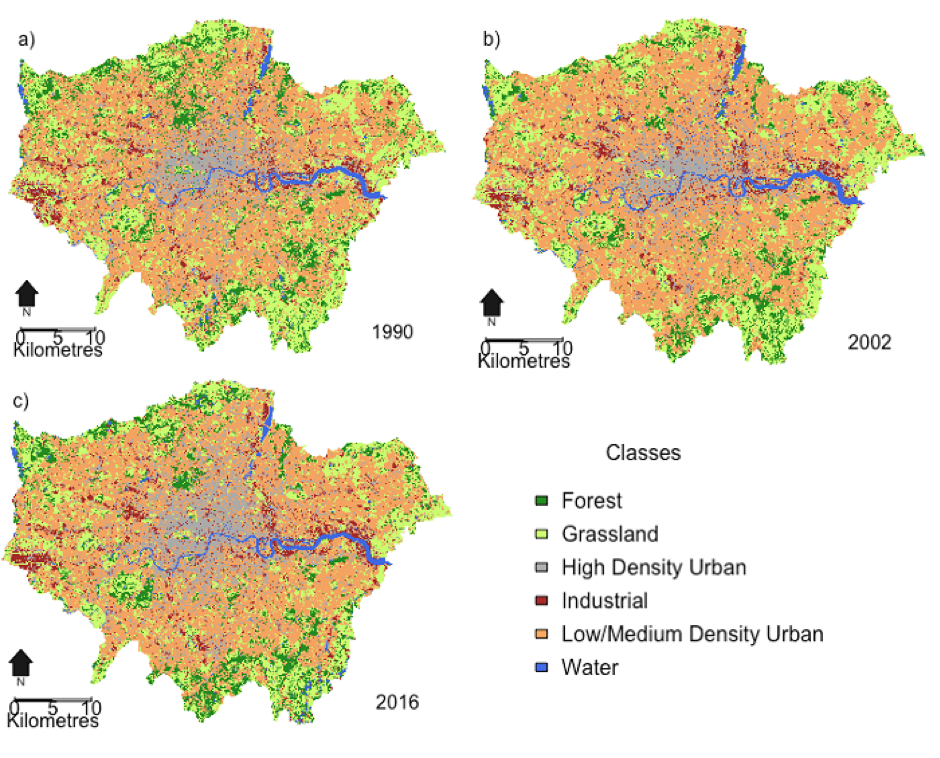
(Langsdale, 2017)
To measure heat vulnerability / temperature through Land Surface Temperature (LST):
MOD11A2 Level-3 MODIS Land Surface Temperature and Emissivity (LST/E) 8-day products (1-km resolution) (Chen, Lin, and Chiu 2022)
ECOSTRESS Land Surface Temperature and Emissivity products (Li et al. 2022)
SOLWEIG: localised temperature modelling(MacLachlan et al. 2021)
Requirement: Elevation (EO: OSM+ CSIRO) + Land cover data (EO: OSM+ CSIRO) + Meteorological data (air temperature, relative humidity, barometric pressure, wind speed, wind direction, and downward shortwave radiation) (e.g. Perth International Airport weather station)
Overall, using LST to quantify urban heat has pros and cons -
4.1.3 Linkages to global goals
The 2030 Agenda for Sustainable Development tied “sustainable cities and communities” to both safety and resilience (SDG 11)
The United Nation New Urban Agenda highlighted cities’ importance to
(g) Adopt and implement disaster risk reduction and management, reduce vulnerability, build resilience and responsiveness to natural and human-made hazards and foster mitigation of and adaptation to climate change;
(h) Protect, conserve, restore and promote their ecosystems, water, natural habitats and biodiversity, minimize their environmental impact and change to sustainable consumption and production patterns.
The United Nation World Cities Report: fostering nature-based solutions and ecosystem services (5.4);
NBSs are promising in the context of halting biodiversity loss and restoring urban ecosystem services in economically viable ways
The International Union for Conservation of Nature (IUCN) defines NBSs as “actions to protect, sustainably manage, and restore (create) natural or modified ecosystems” that simultaneously address social challenges, providing both human well-being and biodiversity benefits.
NBSs are aligned with the United Nations 2030 Agenda for Sustainable Development
4.1.4 Advancing local, national and global approach
Local
Current protection of GB: 1) protected from inappropriate development. 2) improvement projects (discrete cases)
Add-on values: Besides combating UHI (and preventing sprawl), GB also reduces air pollutions, provides local food source and enhances ecosystem and biodiversity.
Optimization for plans: Global policies lack an effective data-driven approach in deriving optimal vegetative placement—particularly for reducing the ever-increasing socio-economic and environmental impacts associated with UHI effects (MacLachlan et al. 2021)
Quality and monitoring. – long-term inspection of quality (changes through time and seasons – identify key areas for improvements / where to spend money on)
National
- National Planning Policy Framework (NPPF) states to protect the integrity of Green Belt. but does not mention how.
Global
- Urban planning rarely integrates biodiversity and ecosystem services into service and design, aside from demonstration projects. (World Cities Report)
4.1.5 Question
- Is there any privacy concern on monitoring via remotely sensed data? (e.g. in the case of watering gardens, what if the residents get angry about being monitored and refuse to make changes?)
- Yes. If the solution/intervention is in private land, the alternative in public space would be provided. The government / clients tend to prevent privacy concerns when deploying a model so the actual deployment could be affected… (could be another drawback of using EO/remote sensing data?).
4.2 Reflection
This section will list some lessons learnt from the policy and remote sensing data application.
Remote sensing data can be used effectively to reduce the labor-intensive work / 3-Ds work (e.g. physically surveying and collecting data) and to some extent increase the accuracy of data collection.
National and global higher level policies and goals tend to be more generic and vague in terms of the solutions and approaches to reach the stated visions. Local policy and guidance, complying the higher level policies, tend to consider the contextual attributes. Thus, it can sometimes be difficult to provide one-size-fit-all solutions in local policy (and academic papers). Nevertheless, the case studies and more detailed guidelines may help in this context (from city planning perspective but many not for other themes like ecology and forestry), as well as the provision of tools and methods like the one on optimization of tree placement.
Some challenges might not be under the control of the city. For instance, Green Belt is beyond the London metropolitan boundary and extend to wider areas. The regulation and effective maintenance might require collaboration from different local authorities. Plus majority of the land on Green Belt is privately owned..
When writing papers, the recommendations / long-term solutions on how to reach the policy goals should be proposed in addition to the findings from the data.